Simulation
Waveform Viewer
On this page
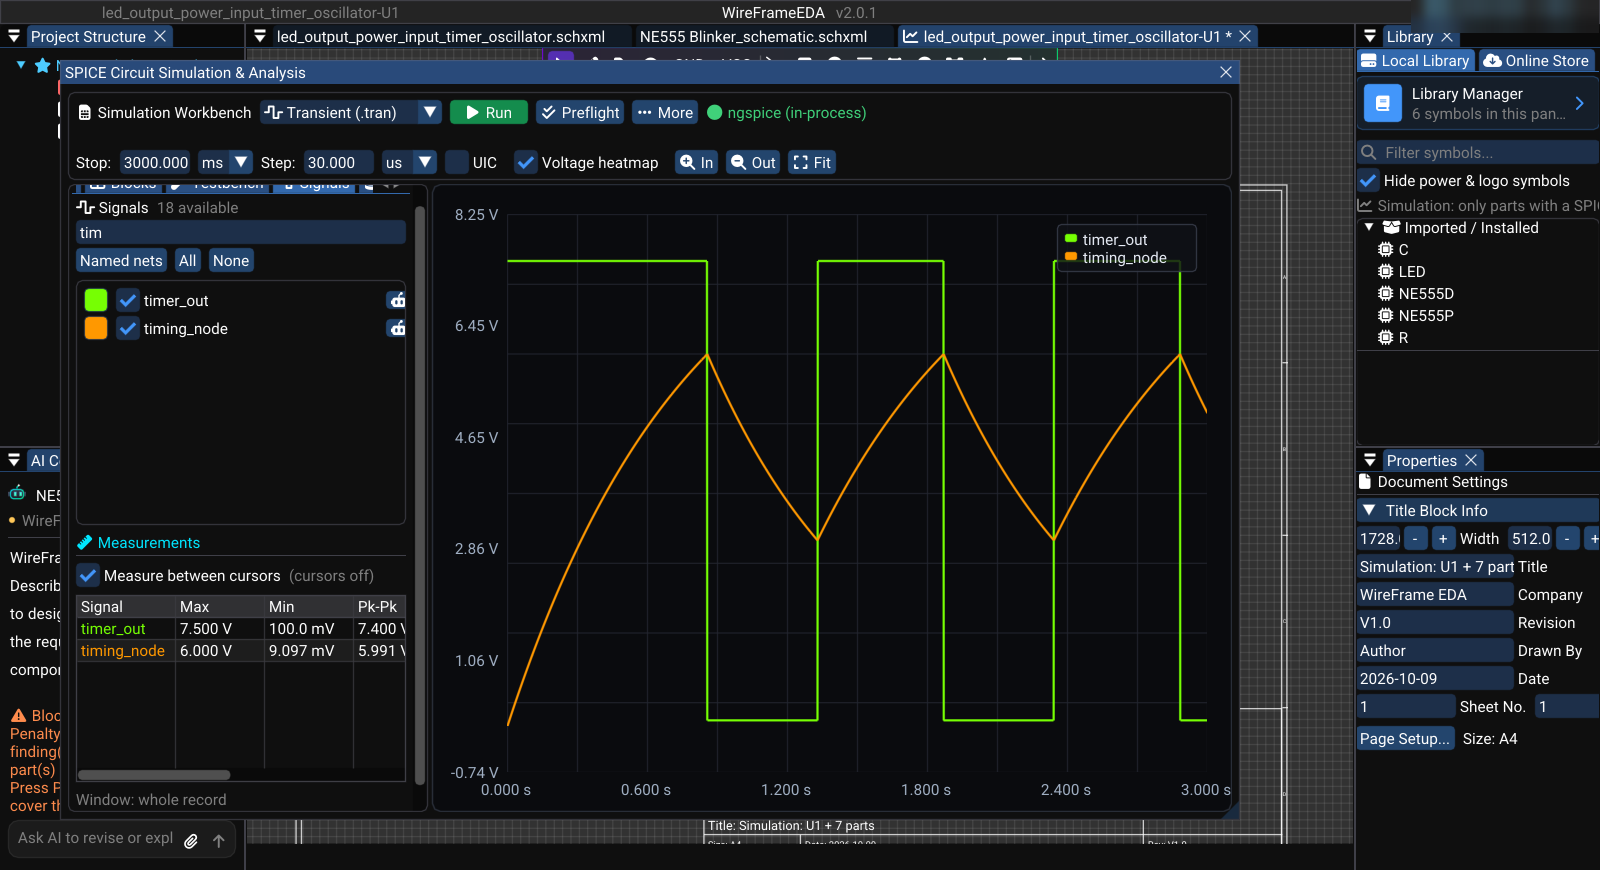
The waveform area displays results from the latest completed run of the simulation in front. Use it to compare selected signals, inspect timing and amplitude, and support testbench decisions.
Select traces#
Open Signals in the Simulation Workbench and select the nets to display. The plot updates from the available result data. Filter signals narrows a long list by name.
Use:
- Named nets for important labeled signals;
- All for broad debugging;
- None before building a focused comparison.
You can also mark a net directly on the simulation's canvas: choose Probe Signal on its toolbar (V) and click a wire, pin, net label, or power symbol. A probe marker is placed on that net. Probes belong to the simulation; sheets of the design have no probe tool.
Under the list, Measurements gives the maximum, minimum, and peak-to-peak of each plotted signal — over the whole record, or between the A/B cursors when Measure between cursors is ticked and the cursors are on.
View controls#
These are under Setup → View:
| Control | Purpose |
|---|---|
| Auto-scale results | Fit available traces to the current plot |
| Grid | Show measurement reference lines |
| Legend | Identify displayed traces |
| A/B cursors | Compare two points on a trace |
Disable auto-scale when you need a stable visual range across repeated runs. Re-enable it when new data falls outside the current view. In, Out, and Fit on the toolbar zoom the time axis.
Use A/B cursors#
- Tick A/B cursors under Setup → View.
- Drag cursor A to the first event.
- Drag cursor B to the second event.
- Read the time of each cursor, the interval (dT), and the matching frequency at the bottom of the plot.
- Record the measurement or add an equivalent testbench assertion when it must be checked repeatedly.
Interpret common analyses#
Transient#
Check startup, delay, rise/fall time, overshoot, ripple, duty cycle, and settling behavior over time.
AC#
Check gain and phase across frequency. Confirm that the selected engine and model support the intended AC behavior.
DC sweep#
Check how an output or operating point changes with a swept source or parameter.
Operating point#
Check steady node voltages and branch currents without interpreting them as time-domain traces.
Compare results safely#
- keep source, load, model version, scope, and analysis settings identical;
- do not compare traces from different runs unless the settings are recorded;
- use assertions for release criteria instead of judging only by visual shape;
- exclude startup from steady-state measurements when appropriate;
- export data when another reviewer needs evidence.
Ask Copilot#
Use the robot action beside a signal or open the AI tab and select Explain the waveform results. State the expected behavior and the relevant time window. Verify the response against the plotted data and testbench limits.